View this report
Summary
- Alcohol-related harms, including hospital admissions and deaths have, relative to other adults, recently increased among older people;
- Those aged 65-74 and those aged 75+ have different patterns of drinking;
- Older people drink more frequently than other adults;
- Older men are more likely to be drinkers, drink more, and drink more often than older women;
- Older people have distinct reasons and approaches to drinking when compared to other populations.
Introduction
How much, what, where, when, and why people drink alcohol differs considerably across the lifespan. This is likely influenced both by changing social position and roles, and also by cohort – how you drink when you are young will influence how you drink when you are older.
The physical and social consequences of drinking also differ considerably, morbidity and mortality is more common in older groups, whether that’s from alcohol or other factors. Some groups face specific risks – underage people may be more vulnerable to setting long-term behaviours, working-age people will be at higher risk of work-based accidents, and older-people may be more vulnerable to chronic health consequences.
This series of briefings on alcohol through the life course will look at three different age groups: underage drinkers, young drinkers, and older drinkers. Understanding the patterns of drinking in different demographics matters as it enables us to identify risks and thus target policy solutions to particular groups.
How to define an older person?
For the purposes of this briefing, older people will generally be used to refer to people aged 65+, however some data is for different age ranges and some of the discussion is based on people aged 55+ years.
Why does older people’s drinking matter?
Drinking among older people presents some unique health risks as older people are more vulnerable to the effects of alcohol and some alcohol-related harms. A range of factors amplify the effect of any given amount of alcohol for older people [1]:
- A reduction in lean body mass reduces the volume of distribution of alcohol (leading to a higher peak blood concentration of alcohol);
- Liver enzymes may process alcohol more slowly, leading to longer-last levels of alcohol;
- The central nervous system may be more sensitive to alcohol’s effects;
- Older people are more likely to be taking medication that might interact with alcohol;
- Consequences such as falls are both more likely and have greater risk of serious consequences.
Measurable health consequences
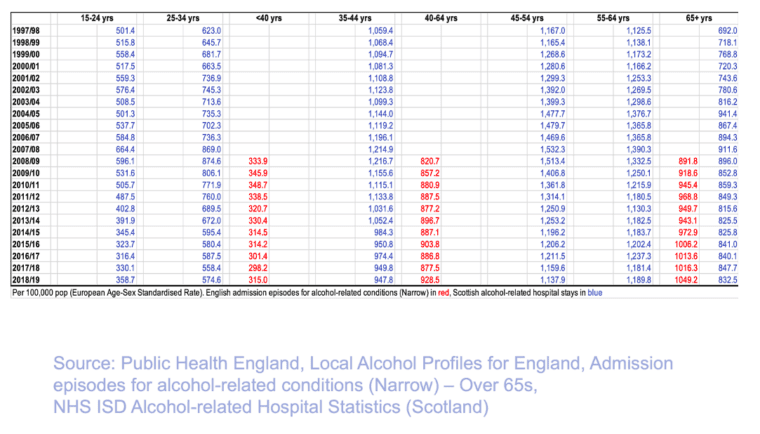
Relative to other adults, the rate of alcohol-related hospital admissions has increased in England and Scotland since the late 2000s [2]. In England, since 2008/09 the rate of alcohol-related hospital admissions in older people appears to have increased faster than that of other age groups [3]. In Scotland, the data are available from 1997/98 and it shows a general increase across most age groups until the late 2000s, then a fall in almost all age groups except those aged 65+ for who admissions have remained close to the levels seen in the late 2000s [4].
Figure 1 Alcohol-related hospital admissions / stays, by age
Alcohol-specific mortality
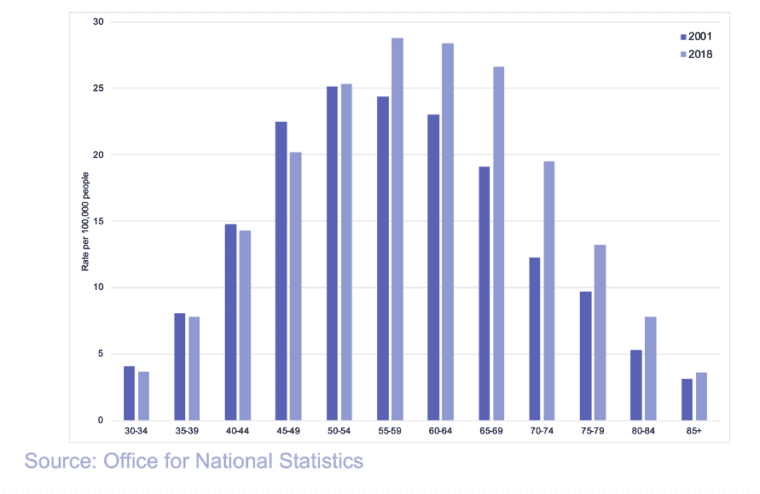
Alcohol-specific mortality is available as a UK-wide figure [5]. In general alcohol-specific mortality has risen in the UK since 2001, and this has been largely driven by a rise amongst those aged 55-79, with statistically significant increases in death amongst those aged 55-79 [6].
Figure 2 Alcohol-specific death rates, UK
Profile of older people’s drinking in the UK
Overall, across the UK people aged 65-74 appear to drink differently to those aged 75+. Drinking amongst 65-74-year-olds more closely aligns with drinking amongst younger adults, whereas those aged over 75 years tend to drink less. However, both age groups have higher rates of frequent drinking than other adults. As is true for all adults, although not in children (see our briefing on underage drinkers), men drink more than women by every metric.
Sources
The constituent parts of the UK collect data in different ways, and as such are often not readily comparable. In general, two age groupings are considered: those aged 65-74 and those aged 75+ years. In England most of the data are drawn from the 2018 NHS Digital’s Health Survey for England [7]. In Scotland an equivalent, the 2018 Scottish Health Survey will be used [8]. For Wales, the data used is from the 2018/19 National Survey for Wales [9]. In Northern Ireland the most up-to-date and readily available information on drinking broken down by age group is from the 2013 Adult drinking patterns in Northern Ireland, which uses the 60-75-year-old age grouping [10]. More recent whole adult population data is available in Northern Ireland, from the Health Survey for Northern Ireland 2018/19, but this does not allow ready access to the breakdown of data by age and is therefore largely not discussed in these briefings [11].
How many older people drink?
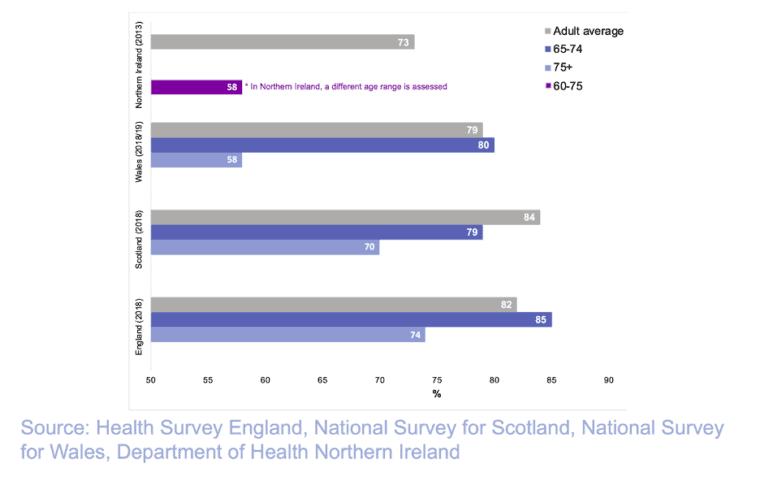
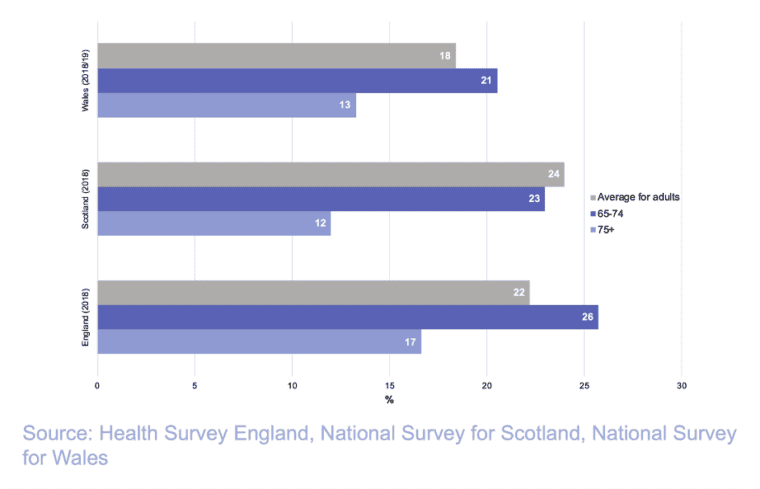
Across the UK, where data is available, a similar pattern is seen with those in the 75+ age group appearing less likely to drink than those in the 65-74 age group. Those in the former are consistently the least likely to drink alcohol of all age groups for, both men and women. In England, 65-74-year-olds appear to drink at similar rates to other adults. In Scotland those aged 65 and over are less likely to drink than other adults, with the lowest prevalence of drinking in those aged 75+. In Wales, those aged 65-74 have a similar prevalence of drinking as other adults, whereas those aged 75+ are less likely to drink. In Northern Ireland, a different age range is assessed (60-75) and older people are less likely to drink than younger people.
In England, there is a readily available time series data going back until 2011. Over that time period the prevalence of drinking in older age appears to have been relatively static, with those aged 65-74 about as likely to be drinkers as other adults, and those aged 75+ consistently less likely to drink [12].
Where data is disaggregated by gender, women are less likely to drink in both age groups, and the pattern by age group seen within each gender is similar.
Figure 3 Proportion of older adults who drink compared with average adult, UK nations
How often do older people exceed weekly drinking guidelines?
The chief medical officers recommend that men and women should not exceed 14 units of alcohol per week [13]. For some older people this may be too high, especially those with physical and mental disorders and those who are taking medication [14]. As with all age groups even these limits are commonly exceeded, and men do so more than women. When looking at the proportion who exceed these guidelines a similar pattern emerges as the one seen amongst drinkers vs. non-drinkers. Those aged 65-74 exceed 14 units per week more often than those aged 75+. In England and Wales, the prevalence of exceeding 14 units per week peaks in the 55-74 age range, whereas in Scotland there does not seem to be the same rise with age. Across England, Scotland, and Wales those aged 75+ are less likely to exceed 14 units a week. Data is not included for Northern Ireland as the old low risk drinking guidelines were used in the survey.
Figure 4 Proportion of older aged drinkers exceeding 14 units in a week, England, Scotland, and Wales
How often do older people drink?
Across the UK older people are relatively frequent drinkers. Different thresholds are readily available in different parts of the UK but in England those aged 65-74 are the most likely of all age groups to drink on more than 4 days a week, followed by those aged 75+ (21% and 18% respectively). In Scotland, the likelihood of drinking on 5 or more days a week rises consistently with age with 22% and 28% of those in the 65-74 and 75% age groups doing so respectively. In Northern Ireland drinking is again more common in older age groups, with 19% of those aged 65-74 drinking almost every day. Data on frequency is not readily available for Wales. These patterns are similar between men and women, but men are considerably more likely to drink frequently than women in all age groups.
Heavy episodic drinking
Single occasion drinking matters as intoxication associates with acute alcohol-related harms including injury and risk taking. Different thresholds for single episode drinking are used for men and women. In England and Wales these are >6/8 units on one occasion for women/men. In England, those aged 65-74 are relatively unlikely to drink >6/8 units on a single occasion compared to other adults those and those aged >75+ are the least likely to do so. A similar pattern, of lower episodic drinking, is seen in Wales in those aged 65+. In Northern Ireland a different threshold of >7/10 units on one occasion for women/men is used, and the prevalence of consuming this amount on one occasion declines with age. This data, broken down by age, is not readily available from Scotland.
When data is broken down by gender men are more likely to exceed these single occasion thresholds than women.
Understanding older people’s drinking
In 2018 the Royal College of Psychiatrists published an update on their report ‘Our Invisible Addicts’, which looked specifically at alcohol and other substance use amongst older people [15]. It highlights in detail the epidemiology, specific health risks, stigma, and challenges of substance use amongst older adults. Amongst other factors the report identifies loneliness, retirement, chronic pain, stress, and insomnia as risk factors for higher risk drinking. Additionally, the report argues that the relatively high levels of consumption and harm seen amongst older people currently may be a generational effect. The ‘baby boomers’ (born 1946-64, currently aged 56-74) may be a generation with particularly high-levels of alcohol consumption.
A systematic review of 12 studies [16] identified the following key factors in modulating alcohol consumption among older people (55+):
- Social life, fun and enjoyment – these were key reasons for drinking;
- Social environment, setting, and social norms – older people often matched their habits to their partner’s, and would also drink in social context with their friends. Retirement appeared to have a mixed impact, reduced socialising might decrease drinking, but increased leisure time might increase it;
- Health-related issues – people cited drinking for the ‘health benefits’ and to relieve symptoms or for relaxation. Ill health, such as a fall or heart attack could also change alcohol consumption, however for some ill-health was viewed as unrelated to the alcohol consumption so drinking continued. A number of studies noted a refusal to acknowledge health risks;
- Drinking to deal with difficulties in life – this included loss, but also to mask declining physical and mental abilities;
- Access – for some access and cost were barriers, but for others price was considered low and encouraged consumption;
- Drinking identities – alcohol was something that could be drunk by choice and thus implied control over that aspect of their lives, which was sought;
- A number of older people had their own self-regulating strategies such as not drinking during the day.
- Barry, K. and Blow, F. (2016). Drinking over the lifespan. Alcohol Research Current Reviews.
- For the difference between alcohol-specific and alcohol-related hospital admissions see: The Institute of Alcohol Studies (accessed 19 June 2020). How alcohol mortality and morbidity rates are calculated in the UK.
- Public Health England (accessed 19 June 2020). Local alcohol profiles for England.
- ScotPHO (accessed 19 June 2020). ScotPHO profiles.
- For the difference between alcohol-specific and alcohol-related hospital admissions see: The Institute of Alcohol Studies (accessed 19 June 2020). How alcohol mortality and morbidity rates are calculated in the UK.
- Office for National Statistics (2019). Alcohol-specific deaths in the UK: registered in 2018.
- NHS Digital (2019). Health Survey for England 2018.
- Scottish Government (2020). The Scottish health survey 2018: main report – revised 2020.
- Welsh Government (last updated 28 February 2020). National survey for Wales: results viewer.
- Northern Ireland Department of Health (2014). Adult drinking patterns in Northern Ireland survey 2013.
- Northern Ireland Department of Health (2020). Health survey Northern Ireland: first results.
- NHS Digital (2019). Health Survey for England 2018.
- Chief Medical Officers (2016). UK Chief Medical Officers’ low risk drinking guidelines.
- Royal College of Psychiatrists (2018). Our Invisible Addicts.
- Royal College of Psychiatrists (2018). Our Invisible Addicts.
- Kelly, S. et al (2018). Alcohol and older people: a systematic review of barrier, facilitators and context of drinking in older people and implications for intervention design. PLoS One.
View this report
