• Skip to primary navigation
  • Skip to main content
  • Skip to footer

Institute of Alcohol Studies HomepageInstitute of Alcohol Studies

Bringing together evidence, policy and practice to reduce alcohol harm

  • Home
  • About us
    • People
    • Our strategy
    • Small Grants Scheme
    • Networks
    • Vacancies
    • Contact us
  • Publications
  • Explore by Topic
    • Alcohol across society
    • Availability
    • Consumption
    • Economy
    • Health
    • Marketing
    • Price
    • The alcohol industry
    • Transport
    • Violence and crime
    • Help and support
  • News & Comment
    • Latest news and events
    • Blog
    • Alcohol Alert
    • Podcasts
    • Videos
    • See all
  • Search

Economy

On this page

  • Facts and stats
  • Briefings
  • Publications
  • Blogs
  • Podcasts
  • Videos

Alcohol harm across the UK has a significant cost associated with it. And due to the extensive impact it has across many aspects of our society, calculating the cost accurately is difficult. Yet there are clear direct costs: to health services, the criminal justice system, and paramedic and police time. These have a direct impact on government finances. And there are also clear indirect costs: from lost productivity due to premature death, the loss of quality of life for the drinker, and drink driving collisions leading to higher insurance rates.

Alcohol harm costs society in England £27.44 billion each year, a 2024 calculation by IAS with support from Balance found. Figures for Scotland, Wales, and Northern Ireland are more dated, with estimates ranging between £6.9 – £11.9 billion total.

Reducing alcohol consumption at a population level is a crucial aspect to reducing both the harm and cost of alcohol to society. Weighing up the economics, there is little convincing evidence to suggest that lower spending would harm the UK economy, and indeed many grounds to believe that reducing drinking could be of economic benefit.

Facts and stats

Cost of alcohol harm in ENGLAND

Overall cost:

£27.44bn

(£485 per head)

Cost Breakdown

Cost per head

NHS & Healthcare: £4.91bn

Alcohol-related hospital admissions cost: £2,225m
Outpatient visits cost: £533m
Alcohol-related A&E visits cost: £1,070m
Alcohol-related ambulance call-outs cost: £857m
Alcohol-related healthcare appointments cost: £90m
Alcohol dependency drugs costs: £4.7m
Specialist treatment for alcohol costs: £73m
Other alcohol-related healthcare costs: £58m

Crime & disorder: £14.58bn

4,181,182

estimated alcohol-related crimes

Including reported and unreported crimes:

  • 836,758 for criminal damage
  • 970,508 for violence against the person
  • 2,179,915 for theft

Costs:

Anticipation of crime:

(e.g. money spent on crime detection/prevention such as burglar alarms)

£830.0m

Consequence of crime:

(e.g. cost of stolen or damaged property and emotional harm to the victim)

£9,284.1m

Response to crime:

(e.g. costs to the police and criminal justice system)

£4,470.0m

Wider economy: £5.056BN

Presenteeism (at work but reduced productivity): £2,206m
Absenteeism (not at work due to illness): £1,754m
Unemployment: £1,096m

Social services: £2.890BN

Local authority budget estimated to be attributable to alcohol:

Alcohol treatment and support services:

For adults: £171m
For children: £14m

Child social services:

£2,705m


Regional stats

RegionTotal costCost per head
East £2.96bn £467
East Midlands £2.41bn £493
London £4.34bn £494
North East £1.49bn £562
North West £3.99bn £538
South East £4.33bn £466
South West £2.51bn £439
West Midlands £2.92bn £490
Yorkshire & The Humber £2.87bn £524

Local Authority stats

Sort:

Search:

Local AuthorityRegionTotal costCost per head
AdurSouth East£27.5m£425
Amber ValleyEast Midlands£59.2m£468
ArunSouth East£66.3m£401
AshfieldEast Midlands£68.3m£541
AshfordSouth East£70.0m£525
BaberghEast£35.7m£386
Barking and DagenhamLondon£108.0m£494
BarnetLondon£157.5m£405
BarnsleyYorkshire and the Humber£120.7m£493
BasildonEast£103.6m£552
Basingstoke and DeaneSouth East£85.0m£458
BassetlawEast Midlands£60.0m£507
Bath and North East SomersetSouth West£81.8m£425
BedfordEast£90.6m£488
BexleyLondon£98.8m£401
BirminghamWest Midlands£694.0m£607
BlabyEast Midlands£44.0m£426
Blackburn with DarwenNorth West£82.3m£531
BlackpoolNorth West£116.6m£828
BolsoverEast Midlands£38.5m£479
BoltonNorth West£165.3m£558
BostonEast Midlands£40.4m£571
Bournemouth, Christchurch and PooleSouth West£158.8m£397
Bracknell ForestSouth East£50.9m£407
BradfordYorkshire and the Humber£330.9m£605
BraintreeEast£72.0m£462
BrecklandEast£61.4m£432
BrentLondon£153.7m£453
BrentwoodEast£34.0m£441
Brighton and HoveSouth East£150.7m£545
Bristol, City ofSouth West£281.3m£597
BroadlandEast£50.2m£380
BromleyLondon£148.6m£450
BromsgroveWest Midlands£45.9m£462
BroxbourneEast£40.8m£412
BroxtoweEast Midlands£46.0m£415
BuckinghamshireSouth East£218.2m£393
BurnleyNorth West£57.3m£605
BuryNorth West£103.5m£534
CalderdaleYorkshire and the Humber£116.7m£564
CambridgeEast£72.9m£503
CambridgeshireEast£288.9m£425
CamdenLondon£128.8m£612
Cannock ChaseWest Midlands£39.2m£390
CanterburySouth East£86.5m£553
Castle PointEast£36.2m£404
Central BedfordshireEast£121.1m£410
CharnwoodEast Midlands£82.9m£453
ChelmsfordEast£86.6m£477
CheltenhamSouth West£61.7m£519
CherwellSouth East£75.0m£464
Cheshire EastNorth West£156.9m£392
Cheshire West and ChesterNorth West£156.6m£438
ChesterfieldEast Midlands£56.9m£548
ChichesterSouth East£47.7m£383
ChorleyNorth West£51.3m£435
City of LondonLondon£22.5m£2,613
ColchesterEast£106.1m£551
CornwallSouth West£226.1m£395
CotswoldSouth West£33.9m£372
County DurhamNorth East£277.1m£532
CoventryWest Midlands£199.0m£580
CrawleySouth East£63.6m£537
CroydonLondon£188.6m£483
CumberlandNorth West£131.4m£480
DacorumEast£66.3m£427
DarlingtonNorth East£62.7m£579
DartfordSouth East£67.5m£578
DerbyEast Midlands£172.0m£659
DerbyshireEast Midlands£372.4m£467
Derbyshire DalesEast Midlands£26.5m£370
DevonSouth West£316.0m£388
DoncasterYorkshire and the Humber£174.1m£564
DorsetSouth West£151.8m£398
DoverSouth East£62.1m£533
DudleyWest Midlands£149.7m£463
EalingLondon£159.0m£434
East CambridgeshireEast£33.1m£376
East DevonSouth West£54.6m£359
East HampshireSouth East£45.2m£358
East HertfordshireEast£59.5m£395
East LindseyEast Midlands£67.5m£472
East Riding of YorkshireYorkshire and the Humber£129.4m£377
East StaffordshireWest Midlands£46.9m£377
East SuffolkEast£104.6m£424
East SussexSouth East£241.4m£441
EastbourneSouth East£51.4m£506
EastleighSouth East£60.1m£439
ElmbridgeSouth East£54.0m£387
EnfieldLondon£146.4m£444
Epping ForestEast£65.5m£486
Epsom and EwellSouth East£32.6m£403
ErewashEast Midlands£56.6m£501
EssexEast£728.3m£483
ExeterSouth West£66.8m£517
FarehamSouth East£46.2m£402
FenlandEast£52.3m£509
Folkestone and HytheSouth East£60.3m£548
Forest of DeanSouth West£31.5m£361
FyldeNorth West£31.8m£388
GatesheadNorth East£106.2m£541
GedlingEast Midlands£47.0m£401
GloucesterSouth West£77.2m£583
GloucestershireSouth West£288.5m£446
GosportSouth East£38.3m£466
GraveshamSouth East£62.6m£586
Great YarmouthEast£58.3m£582
GreenwichLondon£155.9m£539
GuildfordSouth East£65.9m£458
HackneyLondon£149.3m£574
HaltonNorth West£70.0m£545
Hammersmith and FulhamLondon£102.3m£558
HampshireSouth East£609.5m£433
HarboroughEast Midlands£35.3m£360
HaringeyLondon£143.3m£542
HarlowEast£55.8m£597
HarrowLondon£102.2m£392
HartSouth East£45.0m£449
HartlepoolNorth East£62.9m£679
HastingsSouth East£50.6m£556
HavantSouth East£58.9m£473
HaveringLondon£111.6m£426
Herefordshire, County ofWest Midlands£82.7m£441
HertfordshireEast£524.8m£437
HertsmereEast£46.6m£431
High PeakEast Midlands£42.5m£466
HillingdonLondon£135.2m£444
Hinckley and BosworthEast Midlands£45.1m£397
HorshamSouth East£53.6m£364
HounslowLondon£131.7m£457
HuntingdonshireEast£71.1m£391
HyndburnNorth West£44.0m£535
IpswichEast£82.1m£588
Isle of WightSouth East£62.9m£447
Isles of ScillySouth West£0.4m£179
IslingtonLondon£137.6m£635
Kensington and ChelseaLondon£87.5m£608
KentSouth East£845.4m£536
King’s Lynn and West NorfolkEast£67.6m£437
Kingston upon Hull, City ofYorkshire and the Humber£175.6m£659
Kingston upon ThamesLondon£77.0m£459
KirkleesYorkshire and the Humber£225.0m£519
KnowsleyNorth West£87.6m£565
LambethLondon£186.0m£586
LancashireNorth West£575.6m£466
LancasterNorth West£65.6m£462
LeedsYorkshire and the Humber£477.9m£591
LeicesterEast Midlands£206.0m£563
LeicestershireEast Midlands£297.6m£418
LewesSouth East£42.1m£420
LewishamLondon£147.9m£493
LichfieldWest Midlands£36.1m£338
LincolnEast Midlands£69.8m£682
LincolnshireEast Midlands£364.5m£474
LiverpoolNorth West£331.7m£685
LutonEast£109.9m£489
MaidstoneSouth East£91.1m£516
MaldonEast£25.9m£389
Malvern HillsWest Midlands£32.3m£403
ManchesterNorth West£400.9m£729
MansfieldEast Midlands£61.1m£553
MedwaySouth East£177.0m£633
MeltonEast Midlands£20.7m£401
MertonLondon£85.8m£398
Mid DevonSouth West£30.5m£367
Mid SuffolkEast£41.2m£398
Mid SussexSouth East£55.7m£364
MiddlesbroughNorth East£117.6m£818
Milton KeynesSouth East£143.7m£499
Mole ValleySouth East£31.2m£356
New ForestSouth East£75.0m£426
Newark and SherwoodEast Midlands£53.0m£430
Newcastle upon TyneNorth East£181.5m£608
Newcastle-under-LymeWest Midlands£47.4m£385
NewhamLondon£183.1m£522
NorfolkEast£429.5m£468
North DevonSouth West£39.2m£394
North East DerbyshireEast Midlands£45.0m£439
North East LincolnshireYorkshire and the Humber£94.7m£602
North HertfordshireEast£56.1m£420
North KestevenEast Midlands£42.2m£356
North LincolnshireYorkshire and the Humber£79.4m£467
North NorfolkEast£40.3m£390
North NorthamptonshireEast Midlands£174.7m£485
North SomersetSouth West£96.4m£443
North TynesideNorth East£99.3m£475
North WarwickshireWest Midlands£26.5m£406
North West LeicestershireEast Midlands£47.2m£450
North YorkshireYorkshire and the Humber£232.1m£375
NorthumberlandNorth East£146.1m£454
NorwichEast£96.1m£671
NottinghamEast Midlands£203.1m£636
NottinghamshireEast Midlands£384.0m£465
Nuneaton and BedworthWest Midlands£71.8m£535
Oadby and WigstonEast Midlands£21.7m£376
OldhamNorth West£140.8m£582
OxfordSouth East£83.8m£524
OxfordshireSouth East£303.6m£418
PendleNorth West£43.8m£458
PeterboroughEast£123.0m£568
PlymouthSouth West£145.4m£549
PortsmouthSouth East£137.9m£667
PrestonNorth West£82.4m£558
ReadingSouth East£98.1m£567
RedbridgeLondon£136.9m£442
Redcar and ClevelandNorth East£77.6m£568
RedditchWest Midlands£38.8m£446
Reigate and BansteadSouth East£61.6m£407
Ribble ValleyNorth West£22.2m£358
Richmond upon ThamesLondon£77.6m£397
RochdaleNorth West£131.9m£589
RochfordEast£32.3m£375
RossendaleNorth West£32.9m£463
RotherSouth East£39.3m£420
RotherhamYorkshire and the Humber£137.9m£518
RugbyWest Midlands£52.3m£455
RunnymedeSouth East£39.7m£452
RushcliffeEast Midlands£49.4m£413
RushmoorSouth East£45.0m£450
RutlandEast Midlands£12.8m£310
SalfordNorth West£157.6m£582
SandwellWest Midlands£177.4m£519
SeftonNorth West£145.0m£518
SevenoaksSouth East£53.7m£445
SheffieldYorkshire and the Humber£280.8m£506
ShropshireWest Midlands£122.3m£377
SloughSouth East£75.0m£474
SolihullWest Midlands£100.2m£463
SomersetSouth West£253.0m£441
South CambridgeshireEast£59.5m£365
South DerbyshireEast Midlands£46.6m£431
South GloucestershireSouth West£121.0m£416
South HamsSouth West£31.1m£349
South HollandEast Midlands£41.1m£430
South KestevenEast Midlands£59.8m£416
South NorfolkEast£55.3m£388
South OxfordshireSouth East£51.8m£345
South RibbleNorth West£53.3m£479
South StaffordshireWest Midlands£37.5m£339
South TynesideNorth East£77.3m£523
SouthamptonSouth East£171.5m£694
Southend-on-SeaEast£115.9m£642
SouthwarkLondon£165.3m£540
SpelthorneSouth East£44.6m£433
St AlbansEast£64.7m£435
St. HelensNorth West£112.6m£614
StaffordWest Midlands£49.8m£363
StaffordshireWest Midlands£306.2m£349
Staffordshire MoorlandsWest Midlands£33.1m£345
StevenageEast£46.0m£515
StockportNorth West£135.3m£458
Stockton-on-TeesNorth East£120.8m£613
Stoke-on-TrentWest Midlands£142.8m£554
Stratford-on-AvonWest Midlands£52.8m£388
StroudSouth West£47.9m£394
SuffolkEast£335.5m£440
SunderlandNorth East£157.3m£574
SurreySouth East£486.4m£403
Surrey HeathSouth East£33.3m£368
SuttonLondon£87.6m£418
SwaleSouth East£87.3m£574
SwindonSouth West£110.0m£470
TamesideNorth West£137.2m£594
TamworthWest Midlands£30.9m£392
TandridgeSouth East£34.7m£393
TeignbridgeSouth West£47.8m£354
Telford and WrekinWest Midlands£96.0m£517
TendringEast£73.3m£492
Test ValleySouth East£57.1m£435
TewkesburySouth West£36.0m£377
ThanetSouth East£91.5m£650
Three RiversEast£37.9m£403
ThurrockEast£99.9m£568
Tonbridge and MallingSouth East£58.5m£442
TorbaySouth West£74.1m£531
TorridgeSouth West£26.7m£389
Tower HamletsLondon£166.4m£533
TraffordNorth West£110.2m£468
Tunbridge WellsSouth East£53.9m£466
UttlesfordEast£37.8m£411
Vale of White HorseSouth East£52.1m£373
WakefieldYorkshire and the Humber£204.7m£579
WalsallWest Midlands£149.1m£525
Waltham ForestLondon£124.3m£447
WandsworthLondon£162.3m£494
WarringtonNorth West£101.4m£480
WarwickWest Midlands£60.6m£408
WarwickshireWest Midlands£263.5m£440
WatfordEast£49.4m£482
WaverleySouth East£47.0m£365
WealdenSouth East£57.9m£360
Welwyn HatfieldEast£57.8m£483
West BerkshireSouth East£62.8m£388
West DevonSouth West£19.3m£336
West LancashireNorth West£43.6m£372
West LindseyEast Midlands£43.7m£457
West NorthamptonshireEast Midlands£217.3m£510
West OxfordshireSouth East£41.5m£360
West SuffolkEast£72.7m£402
West SussexSouth East£365.7m£413
WestminsterLondon£176.7m£862
Westmorland and FurnessNorth West£89.3m£393
WiganNorth West£186.4m£565
WiltshireSouth West£200.5m£390
WinchesterSouth East£52.9m£413
Windsor and MaidenheadSouth East£59.7m£388
WirralNorth West£166.4m£519
WokingSouth East£42.9m£413
WokinghamSouth East£62.4m£350
WolverhamptonWest Midlands£157.4m£596
WorcesterWest Midlands£44.5m£430
WorcestershireWest Midlands£261.4m£432
WorthingSouth East£52.0m£466
WychavonWest Midlands£54.8m£412
WyreNorth West£46.6m£415
Wyre ForestWest Midlands£45.2m£444
YorkYorkshire and the Humber£91.7m£455
Cost of Alcohol in England MethodologyDownload

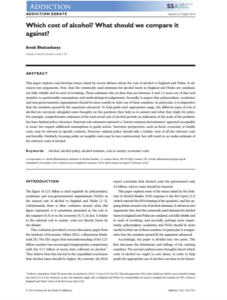
  • A 2024 estimate of the cost of alcohol in England by IAS came to £27.44 billion. This used the same method as a Cabinet Office calculation from 2003.
  • However, this only represents the ‘external’ cost of alcohol to society – the costs imposed by drinkers upon others – and excludes any private costs.
  • Another widely cited range is between £27 and £52 billion. This comes from a study that collated estimates from different countries and found a range between 1.4-2.7% of national income, which Public Health England then applied to UK national income in 2016. Using national income in 2023, this range would be between £37 and £72 billion.
  • Examples of private costs are: spending on alcohol, loss of quality of life, lawyers’ fees, and private medical expenditure.
  • Examples of external costs of alcohol are: treating health problems, violence and crime suffered as a result of drinking, and economic loss due to premature deaths.
  • External costs are important because they are imposed upon third parties without their consent. They are not reflected in the market price.
  • There is general agreement that ‘externalities’ such as this justify government intervention, with standard economic theory suggesting alcohol taxes (and thus the consumer) should cover the full price of the social cost of drinking.
  • Tangible costs are those that involve the loss of resources that could otherwise be used for spending or investment. These are commonly assigned financial value, and so are easier to estimate. For example, health care and criminal justice costs represent sums of money that would not otherwise have to be paid by the government.
  • Intangible costs, such as the fear of crime or the loss of quality of life, by contrast, would not yield resources if eliminated, and are therefore inherently more difficult to value.
  • Productivity is lost in a number of ways:
    • Presenteeism: Though quantifying its prevalence and magnitude is tricky, evidence suggests that alcohol consumption reduces people’s productivity at work.
    • Absenteeism: Studies have found that high levels of drinking, particularly in men, is linked to higher rates of absence from work.
    • Unemployment: Studies have found that heavy drinking is associated with a higher risk of unemployment.
    • Premature Death: Alcohol-related deaths reduce the size of the labour force. It has been estimated that 167,000 years of working life were lost in England in 2015 due to alcohol, 16% of all working years lost. (PHE, 2016)
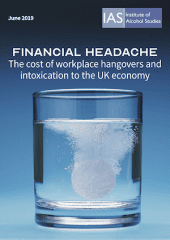
  • Every year, workplace hangovers are estimated to cost the UK economy between £1.2 and £1.4 billion. (IAS, 2019)

Copy of How much do workplace hangovers cost the UK economy? by The Institute of Alcohol Studies

  • The best estimate suggests £14.9 – £15.9 billion is lost in government revenue each year due to alcohol harm in England and Wales alone, consisting of:
    • Direct costs to the health services – £4.9 billion
    • Costs to the criminal justice system – £4.5 billion
    • Social care costs – £2.9 billion
    • A shrinking tax base due to a less productive workforce – £2.6 – 3.6 billion (IAS, 2017 and 2024 cost analysis)
  • Approximately £12.5 billion is raised via alcohol excise duty each year. This increases to around £15 billion raised after VAT is levied.
  • One of the purposes of excise duties is to discourage the consumption of goods that are deemed harmful to consumers’ health or the environment. So, tobacco products, gambling activities, and certain fuels, have duties imposed on them.
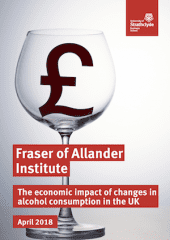
  • The alcohol industry is a small but not insignificant part of the UK economy, contributing around £46 billion a year to national income, around 2.5% of total GDP. (IAS, 2017)
  • This is split between production (e.g. brewers, distillers) and retail (e.g. pubs, bars, and supermarkets). Excluding £2.6 billion in gross capital formation, this includes:
    • £17.5 billion from tax
    • £3.0 billion from off-trade retailers
    • £8.3 billion from on-trade retailers
    • £1.6 billion from distributors and wholesalers
    • £6.1 billion from exports
    • £7.0 billion from domestic producers
  • The most significant production is beer for the domestic market and spirits for export.
  • The alcohol industry is responsible for around 770,000 jobs, approximately 2.5% of UK employment. (IAS, 2017)
  • The vast majority of these are in pubs, clubs, and bars, around 506,000. These are typically part-time and poorly paid.
  • By contrast, alcohol producers provide far fewer jobs (around 30,000) but have much higher wages. This is because it is more efficient to produce alcohol than to sell it, due to mechanisation of breweries and distilleries.
  • Employment in pubs has remained very stable in recent years, despite many establishments closing. This suggests larger pubs have gained share at the expense of smaller ones.


Employees – public houses and bars, 2001 to 2021 by The Institute of Alcohol Studies

  • Reducing alcohol harm requires the reduction of consumption. This has caused alarm among the industry and some politicians; however, it is likely that lower alcohol consumption would boost national income.
  • Firstly, lower consumption may occur alongside the purchasing of more expensive drinks – what the industry refers to as ‘premiumisation’ – which could mean spending does not decline.
  • Yet even if spending on alcohol declines, spending on other goods is likely to rise to compensate and so boost other industries.
  • In the ‘long run’ (when productive capacity is the main constraint on the economy) lower alcohol consumption is likely to have a positive effect by boosting productivity and labour supply, by reducing absenteeism, presenteeism, unemployment, and premature mortality.
  • In the ‘short run’ (when a shortage of demand is the main constraint on the economy), the effect is more uncertain and depends critically on what products are purchased instead of alcohol.
  • The Office for Budget Responsibility’s analysis suggests that the long run effects are more relevant to the UK economy at the present time.
  • Evidence suggests that average alcohol consumption falls slightly during economic crises.
  • Crucially however, such crises often see a polarisation of drinking patterns, with certain groups consuming less and others more.
  • During the recession of 2008/9 in England, there was a small but statistically significant decrease in frequent drinking (defined as drinking on four or more days in the past week), from 27.1% in 2006 to 23.9% in 2009. (EJPH, 2013)
  • Yet there was a rise in heavy episodic drinking among unemployed drinkers.
  • During the start of the first COVID-19 lockdown in the UK, although 26% of adults reported consuming less alcohol, the same percentage reported drinking more than usual over the past week. (Drug and Alcohol Dependence, 2021)
  • During economic crises, governments may reduce expenditure on public services, which in turn can affect health outcomes.

Briefings

Autumn Budget Analysis 2024

November 2024

The costs of alcohol to society

October 2024

Alcohol and Economic Crises

April 2024

The alcohol industry: an overview

A brief history of alcohol duty

Publications

Spending Review submission 2025

January 2025

IAS Autumn Budget Submission 2024

October 2024

Dispelling Six Industry Myths About Alcohol Taxation

January 2024

How have governments communicated UK alcohol duty policy changes?

June 2023

Spring Budget 2023 Analysis

April 2023

Who pays the tab? The distributional effects of UK alcohol taxes

February 2020

Modelling the impact of alcohol duty policies since 2012 in England & Scotland

October 2019

Pour decisions? The case for reforming alcohol duty

Pour decisions

September 2019

Financial headache: the cost of workplace hangovers and intoxication to the UK economy

June 2019

The economic impact of changes in alcohol consumption in the UK

April 2018

Pubs quizzed: What publicans think about policy, public health and the changing trade

September 2017

Cider duty in the Republic of Ireland

June 2017

Which cost of alcohol? What should we compare it against?

April 2017

Splitting the bill: Alcohol’s impact on the economy

February 2017

Dereliction of duty: Are UK alcohol taxes too low?

March 2016

The impact of abolishing the alcohol duty escalator

May 2014

IAS analysis of responses to the Home Office Consultation on minimum pricing

December 2013

Is alcohol too cheap in the UK? The case for setting a Minimum Unit Price for alcohol

April 2013

Blogs

12143Gone but not forgotten: Why was the Northern Territory’s Minimum Unit Price removed?

Gone but not forgotten: Why was the Northern Territory’s Minimum Unit Price removed?

Dr Nic Taylor and Dr Cassandra Wright

1st April 2025

12154How could the US-EU alcohol tariff war affect alcohol consumption and harm?

How could the US-EU alcohol tariff war affect alcohol consumption and harm?

Dr Norman Giesbrecht and Professor Tim Stockwell

25th March 2025

11598How do economic crises impact levels of alcohol harm, and who is most affected?

How do economic crises impact levels of alcohol harm, and who is most affected?

Poppy Hull

18th July 2024

11543Beyond Personal Harm: The Costs of Alcohol to Society

Beyond Personal Harm: The Costs of Alcohol to Society

Kat Petrilli

5th June 2024

10699Can we increase government revenue by raising alcohol taxes?

Can we increase government revenue by raising alcohol taxes?

Dr Jakob Manthey

26th March 2024

10676Why do countries with high alcohol taxes still have high rates of alcohol harm?

Why do countries with high alcohol taxes still have high rates of alcohol harm?

Jem Roberts and Professor John Holmes

4th March 2024

10518Alcohol duty frozen in Autumn Statement: What does this mean?

Alcohol duty frozen in Autumn Statement: What does this mean?

Jem Roberts

24th November 2023

10120Can alcohol duties be used to reduce the rate of violence injury?

Can alcohol duties be used to reduce the rate of violence injury?

Professor Kent Matthews

20th June 2023

Podcasts

How to shift the dial on alcohol policy in Europe

On this month’s podcast we spoke to Florence Berteletti and Anamaria Suciu, who work for the European Alcohol Policy Alliance, […]

Florence Berteletti – Eurocare
Anamaria Suciu – Eurocare

March 2025

Bottling Up Trouble: alcohol, workplaces, and the need for change

On this month’s podcast we spoke to Tabbin Almond, alcohol-freedom coach and author of the recent book: ‘Bottling Up Trouble: […]

Tabbin Almond – Alcohol-freedom coach and author

February 2025

Aveek Bhattacharya

Chancellor keeps off-trade duty in line with RPI while increasing Draught Relief

On this month’s podcast we spoke to Dr Aveek Bhattacharya, Research Director at the Social Market Foundation, about the decisions […]

Dr Aveek Bhattacharya – Social Market Foundation

November 2024

Reasons for (cautious) optimism with the new government

On this month’s podcast we spoke to Lisa Erlandsen, the Policy and Advocacy Manager at the Alcohol Health Alliance. We […]

Lisa Erlandsen – Alcohol Health Alliance

July 2024

Videos

Footer

IAS is proud to be a member of

  • Twitter
  • Bluesky
  • Spotify
  • YouTube
  • LinkedIn

Contact us

©2025 Institute of Alcohol Studies

Terms and Conditions | Privacy Policy

We use cookies to ensure that we give you the best experience on our website. If you continue to use this site we will assume that you are happy with it.Ok