
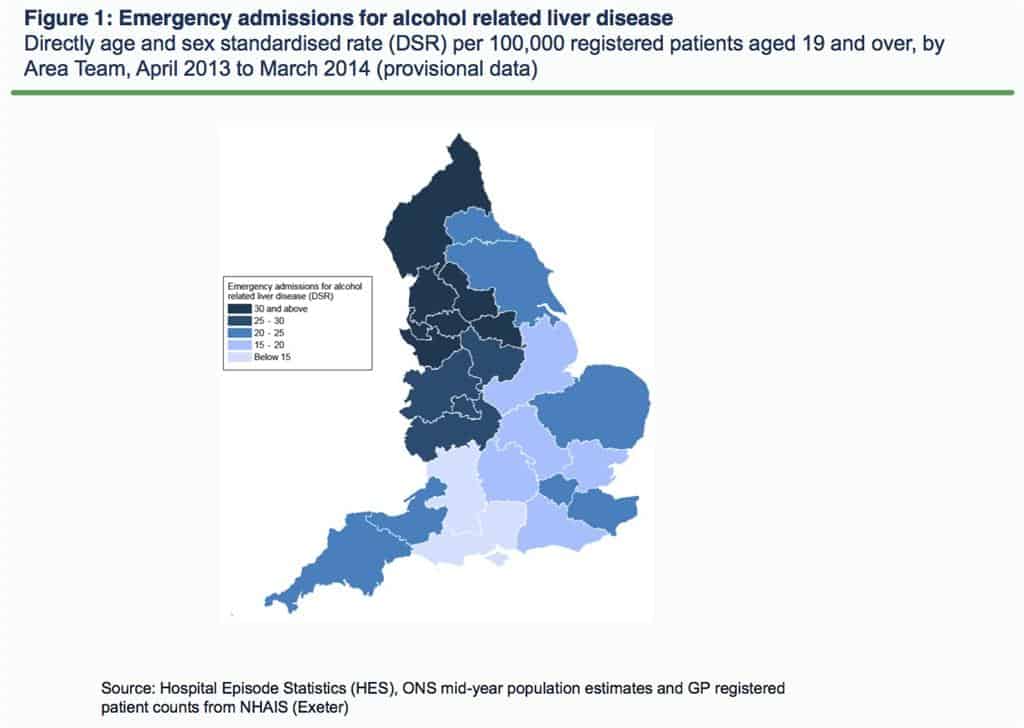
Areas of the North West and North East of England have the highest rate of emergency hospital admissions for alcohol-related liver disease in the country, new figures show.
The Health and Social Care Information Centre (HSCIC) has published a regional map of emergency admissions per 100,000 of the adult population alongside new data at national, Area Team and Clinical Commissioning Group (CCG) level (see below).
The provisional data shows that nationally, hospitals admitted 10,500 cases of alcohol-related liver disease between April 2013 and March 2014 – equating to just over 200 admissions a week.
Regionally, the Area Teams with the highest rate of emergency hospital admissions among the adult population in the same time period were:
- Greater Manchester at 45.8 admissions per 100,000 of the population (1,010 admissions in total – or just over 19 per week on average)
- Merseyside at 41.3 admissions per 100,000 of the population (414 admissions in total – or about eight per week on average).
- Lancashire at 38.9 admissions per 100,000 of the population (472 admissions in total – or about nine per week on average).
The Area Teams with lowest rate were:
- Bath, Gloucestershire, Swindon and Wiltshire at 14.7 admissions per 100,000 of the population (182 admissions in total – or just under four per week on average).
- Wessex at 14.7 admissions per 100,000 of the population (330 admissions in total – or about six per week on average).
- Hertfordshire and the South Midlands at 15.1 admissions per 100,000 of the population (335 admissions in total – or about six per week on average).
HSCIC chair Kingsley Manning said: “This map paints a powerful picture of one of the many impacts that alcohol has on patients and the NHS in this country. This one image depicts what the hundreds of rows of data published today mean for different areas of England.
“While many will be familiar with the HSCIC’s annual alcohol statistics, fewer people may be aware we also publish a myriad of different health and social care indicators about different conditions and care on a regular basis.
“The data we have presented today about alcohol related liver disease is the first such provisional data for 2013/14 to be published at such a local level. It should act as basis to help the NHS commission services effectively.”
This article was taken from the HSCIC press release. The CCG Emergency admissions for alcohol related liver disease map forms part of the CCG Outcomes Indicator Set.
From page 1 of the CCG Outcomes Indicator Set, Health and Social Care Information Centre (HSCIC).